In my life, and the lives of many twenty-somethings, there
are a lot of little messes that fill my daily life that I try (mostly in vain)
to keep ORGANIZED.
Areas of disorganization that plague me most often are:
laundry, groceries, dishes, toiletries, pet food, video game equipment, digital
photos, digital music, books (paper, not digital), and SCHOOL WORK-
notes, textbooks, and papers. I imagine that my approach to the majority of my little messes is much like
the process of any other person who does laundry, organizes grocery shopping,
loads and unloads a dishwasher, and
attends school- everything has a place
in these areas (and for the most part approaches to organizing these
areas are ubiquitous).
My approaches to my other little messes may be more or
less common, but my organizational system for digital pictures is something new
and possibly less common. The Picasa program is something that my fiance and I
are adopting so that we can tag our photos
and hopefully make them more accessible
than the endless folders of garbage that
we have accumulated up to this point. My fiance has TagsAlbums on his iPhone
and he is starting to "tag on the fly" when he takes pictures so that
when he eventually syncs them to Picasa on the computer at home- they will all
still be accessible to him. The ability to add these tags provides a layer of context that keeps the photos accessible- giving my fiance and I the opportunity to draw relationship lines between the content of the photos-the faces of those pictured-the dates-the times-the locations- all relevant and useful data that will allow us to relocate these images in the future.
Valdis Kreb's (developer of InFlow software) approach to drawing relationship lines between relevant data was a particularly interesting subject in chapter nine of Weinberger's book. Kreb's approach, particularly in the example of an office setting, illustrated the importance of his work beautifully. In an office setting, with a particular food chain organizational design, charting the actual lines of communication and noting the individuals of particular importance reveals much more about how the company can get effective work done than the black and white organizational design. Kreb's design reveals the truth of information flow and innovation- "innovation happens at the intersections" of conversational lines (p 181).
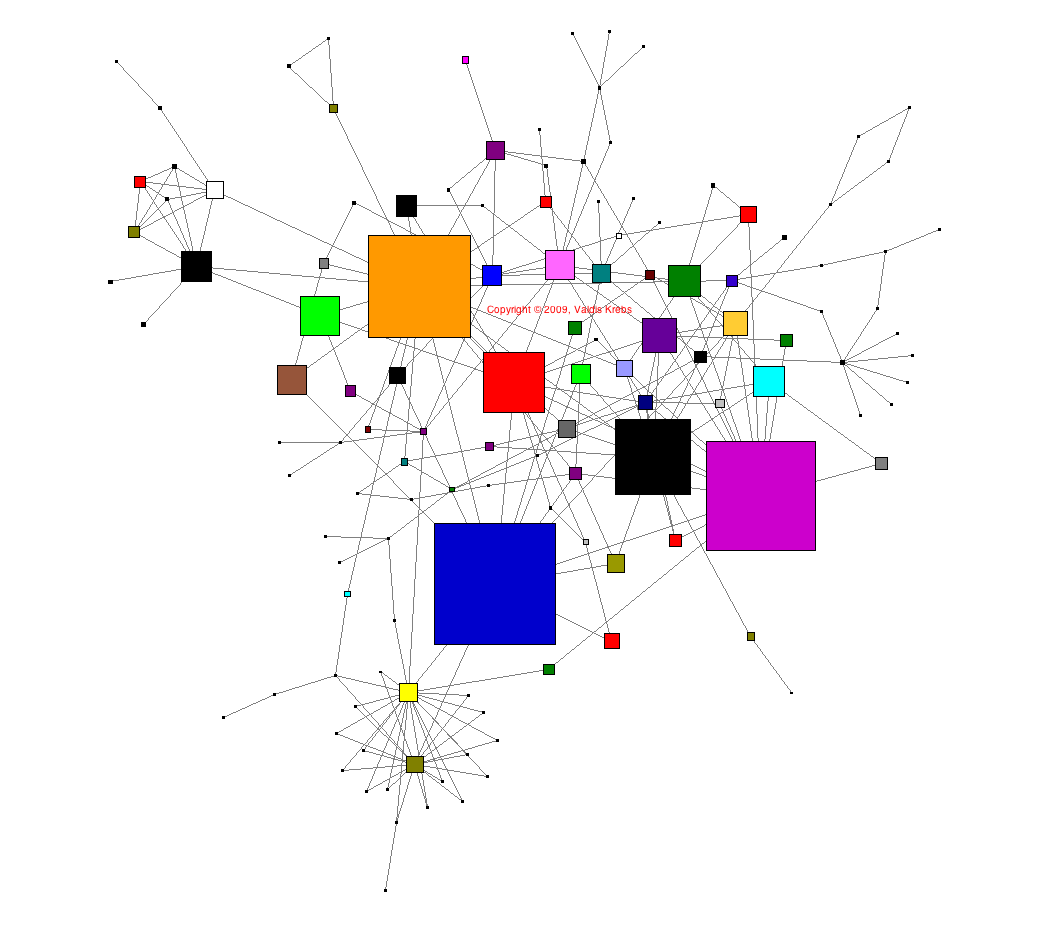 |
| Kreb's Organizational Interrelationships |
As an information scientist, this design is particularly fascinating to me because of all the information it reveals. The added layers of contexts, social relationships, and communication, speak volumes about human nature and the interaction of ideas. A simple organizational chart describes nothing more to the viewer than what the order "should be," even though we all know that it never is that organized. Humans are simply too complex and all work involves intersections of communication. It's clear that displaying linked data will always more accurately reflect the physical world, and I would love to see the ways in which this could be applied to digital media and technology. (Again, reminding me of the Facebook friend mapping and other tools I have previously discussed.) This approach is far from McCallum's system of organization.
 |
| McCallum's Organized Railroad Map |
The idea of linked data and the importance of relationships between information directly links to the concept of the prototype- the indisputable examples of things we can't quite define. There are many nouns in this world, and we like to organize them... however, our work is impossible to organize with McCallum's organizational prowess and we are more likely than not to wind up organizing these nouns in a Kreb's-like fashion- according to relationships and associations when direct links cannot be identified. Overall, I liken this knowledge based on prototypes to Dervin's Sense Making Methodology- a model based on filling in uncertainty with new fluid knowledge. When we take in new information from our environment we add it to our mental stock by identifying ans associating how this new information relates to the information we already have- we compare the information and either associate it with a prototype or create a new one. All of our prototypes are dependent on our individual contexts and they are all impacted by social interactions- they are ever-evolving. There is no perfect definition. There is no perfect organization.
My personal prototype for the library involves: 1) "The Library"- an official building (with signage), usually built with bricks, located near the center of a town, 2) "Information"- Rows upon rows of books, magazines, and computers, 3) "Help"- employees who help you allocate resources. For the most part, my personal library prototype seems like it could translate to other cultures. A library is always a place that houses information and is run by employees. The contents of the global libraries will probably always vary based on the accessibility of technology, but they will always be centers of knowledge.
 |
| National Symbol for "Library" |
No comments:
Post a Comment